Despite earlier bluster and claims that traditional mechanical watch buyers wouldn't be drawn to smart watches, some Swiss watch companies now seem to be doing an about-face and are embracing the idea of smart technology on the wrist. TAG Heuer released a "smart" version of its famous Careera watch earlier this month, which runs on Google's Android Wear platform and retails for $1,500.
Monday, December 7, 2015
Creative destruction, illustrated
Swiss watch exports suffer largest decline in 6 years following Apple Watch launch
Sunday, November 22, 2015
How is Development Econ taught in developing countries?
Interesting research from the WB:
Next time I'll incorporate data crunching in the exam; quote:
[D]eveloping country classes largely rely on written exams, essays, and presentations, and very rarely require students to use statistical software or answer...
Saturday, November 21, 2015
Monday, October 26, 2015
Saturday, October 10, 2015
Friday, October 9, 2015
Cointegration and drunkards
A rather creative stylized description of cointegration:
Suppose you see two drunks (i.e., two random walks) wandering around. The drunks don't know each other (they're independent), so there's no meaningful relationship between their paths.
But suppose instead you have a drunk walking with her dog. This time there isa connection. What's the nature of this connection? Notice that although each path individually is still an unpredictable random walk, given the location of one of the drunk or dog, we have a pretty good idea of where the other is; that is, the distance between the two is fairly predictable. (For example, if the dog wanders too far away from his owner, she'll tend to move in his direction to avoid losing him, so the two stay close together despite a tendency to wander around on their own.) We describe this relationship by saying that the drunk and her dog form a cointegrating pair.
Thursday, October 1, 2015
Algorithms 101
Also a tribute to the pioneering and Nobel-winning work of Lloyd Shapley and Alvin Roth.
Friday, September 18, 2015

Gary Becker's last paper?
Published posthumously: "A theory of intergenerational mobility" (August 2015).
http://www.kellogg.northwestern.edu/faculty/spenkuch/research/mobility.pdf
http://www.kellogg.northwestern.edu/faculty/spenkuch/research/mobility.pdf
Thursday, September 17, 2015

Where Becker went wrong
Excerpt from Tabarrok on MR:
Inspired by Becker, a large, credible, empirical literature–including my own work on police (and prisons)–has demonstrated that this is no myth, the police deter. Score one for rational choice theory. It’s a far cry, however, from police deter to twenty years in prison deters twice as much as ten years in prison. The rational choice theory was pushed beyond its limits and in so doing not only was punishment pushed too far we also lost sight of alternative policies that could reduce crime without the social disruption and injustice caused by mass incarceration.
Wednesday, September 9, 2015
Sunday, August 30, 2015
Monday, August 24, 2015
Tuesday, August 18, 2015
Sunday, July 26, 2015
Restaurants vs. groceries
In the US, food consumed from restos & bars have overtaken food consumed from grocery stores (in terms of value in USD). I think a similar trend is happening in the Philippines with the proliferation of new restos and food concepts around the Metro.

Wednesday, July 22, 2015
Population pyramid of the Philippines: 2015 vs. 2040
By 2040, we'll feel the bulge in the middle, and those aged 15-24 will be the most populous (no longer those aged under 5). Source of data: PSA Census projections (medium assumption).


Thursday, July 16, 2015

Monday, July 13, 2015
Historical Philippine unemployment data
The Philippine LFS or Labor Force Survey actually goes way back 1956. However, changes in definitions, sampling methodologies, etc. over the years have resulted in at least 6 distinct series of unemployment data that cannot be compared with one another one-for-one (see graph below).

So how do we assess the Philippines' unemployment situation? According to NEDA staff, indeed the best possible statement to make is that 2014's unemployment rate of 6.8% is the lowest since 2005, the earliest year against which today's unemployment data can be compared. (Still, one must be mindful that 2014 data exclude Reg. VIII due to Yolanda.)

So how do we assess the Philippines' unemployment situation? According to NEDA staff, indeed the best possible statement to make is that 2014's unemployment rate of 6.8% is the lowest since 2005, the earliest year against which today's unemployment data can be compared. (Still, one must be mindful that 2014 data exclude Reg. VIII due to Yolanda.)
Sunday, July 5, 2015


Thursday, June 25, 2015
Monday, June 8, 2015

Sunday, May 17, 2015
5 most important graphs of the day
1. There are fewer Americans identifying themselves as "Christian" (and "religious"). Source: The Economist.

2. Some evidence that innovation and religiosity are inversely related. Source: The Economist.


2. Some evidence that innovation and religiosity are inversely related. Source: The Economist.

3. The share of food eaten outside home has now exceed the share of food eaten at home (at least in the US). Source: Carpe Diem blog.

4. Current and future world economic development in one graph.

5. Direction of illegal migration into Europe. Source: The Economist.

Friday, May 15, 2015

Thursday, May 7, 2015
Data "scraping" and Argentinian prices


Researchers can create their own data sets by "scraping" the web: that is, by writing programs that will download data from various websites at regular intervals. One of the best-known of these projects is the Billion Prices Project run by Alberto Cavallo and Roberto Rigobon at MIT. Their program downloads detailed data on prices and product characteristics from websites all over the world every day on hundreds of thousands of products. For a sense of the findings that can emerge from this kind of study, here's one graph showing the US price level as measured by the Billion Prices Project and the official Consumer Price Index. They are fairly close. Next look at the price level from the Billion Prices Project and the official measure of inflation in Argentina. It's strong publicly available evidence that the government in Argentina is gaming its inflation statistics.
Monday, May 4, 2015

Sunday, April 26, 2015
2015 Clark Medalist: Roland Fryer Jr.

Roland Fryer is an influential applied microeconomist whose work spans labor economics, the economics of education, and social problems and social interactions. His innovative and creative research contributions have deepened our understanding of the sources, magnitude, and persistence of U.S. racial inequality. He has made substantial progress in evaluating the policies that work and do not work to improve the educational outcomes and economic opportunities of children from disadvantaged backgrounds. His theoretical and empirical work on the “acting white” hypothesis of peer effects provides new insights into the difficulties of increasing the educational investments of minorities and the socially excluded. Fryer is the leading economist working on the economics of race and education, and he has produced the most important work in recent years on combating the racial divide, one of America’s most profound and long-lasting social problems.He has mastered tools from many disciplines to tackle difficult research topics. Fryer has developed and implemented compelling randomized field experiments in large U.S. urban school districts to evaluate education interventions. He founded EdLabs (the Education Innovation Laboratory at Harvard University) in 2008 to facilitate such efforts and continues as its director. He has incorporated insights from psychology to formulate a new model of discrimination based on categorization, and he has used detailed historical archival research to understand the origins and spread of the Ku Klux Klan.
Wednesday, April 22, 2015
Infographic of the day: Maritime forces
Of ASEAN countries and their neighbors. The big bully is big indeed.

Sunday, April 12, 2015

How to report "non-significant" results
Below is a list of (rather humorous) excerpts from published journal articles demonstrating how researchers try to put in a better light their non-significant results (based on p-values>5%). The list comes from here (the Probable Error blog).
a barely detectable statistically significant difference (p=0.073)
a borderline significant trend (p=0.09)
a certain trend toward significance (p=0.08)
a clear tendency to significance (p=0.052)
a clear trend (p<0.09)
a clear, strong trend (p=0.09)
a considerable trend toward significance (p=0.069)
a decreasing trend (p=0.09)
a definite trend (p=0.08)
a distinct trend toward significance (p=0.07)
a favorable trend (p=0.09)
a favourable statistical trend (p=0.09)
a little significant (p<0.1)
a margin at the edge of significance (p=0.0608)
a marginal trend (p=0.09)
a marginal trend toward significance (p=0.052)
a marked trend (p=0.07)
a mild trend (p<0.09)
a moderate trend toward significance (p=0.068)
a near-significant trend (p=0.07)
a negative trend (p=0.09)
a nonsignificant trend (p<0.1)
a nonsignificant trend toward significance (p=0.1)
a notable trend (p<0.1)
a numerical increasing trend (p=0.09)
a numerical trend (p=0.09)
a positive trend (p=0.09)
a possible trend (p=0.09)
a possible trend toward significance (p=0.052)
a pronounced trend (p=0.09)
a reliable trend (p=0.058)
a robust trend toward significance (p=0.0503)
a significant trend (p=0.09)
a slight slide towards significance (p<0.20)
a slight tendency toward significance(p<0.08)
a slight trend (p<0.09)
a slight trend toward significance (p=0.098)
a slightly increasing trend (p=0.09)
a small trend (p=0.09)
a statistical trend (p=0.09)
a statistical trend toward significance (p=0.09)
a strong tendency towards statistical significance (p=0.051)
a strong trend (p=0.077)
a strong trend toward significance (p=0.08)
a substantial trend toward significance (p=0.068)
a suggestive trend (p=0.06)
a trend close to significance (p=0.08)
a trend significance level (p=0.08)
a trend that approached significance (p<0.06)
a very slight trend toward significance (p=0.20)
a weak trend (p=0.09)
a weak trend toward significance (p=0.12)
a worrying trend (p=0.07)
all but significant (p=0.055)
almost achieved significance (p=0-065)
almost approached significance (p=0.065)
almost attained significance (p<0.06)
almost became significant (p=0.06)
almost but not quite significant (p=0.06)
almost clinically significant (p<0.10)
almost insignificant (p>0.065)
almost marginally significant (p>0.05)
almost non-significant (p=0.083)
almost reached statistical significance (p=0.06)
almost significant (p=0.06)
almost significant tendency (p=0.06)
almost statistically significant (p=0.06)
an adverse trend (p=0.10)
an apparent trend (p=0.286)
an associative trend (p=0.09)
an elevated trend (p<0.05)
an encouraging trend (p<0.1)
an established trend (p<0.10)
an evident trend (p=0.13)
an expected trend (p=0.08)
an important trend (p=0.066)
an increasing trend (p<0.09)
an interesting trend (p=0.1)
an inverse trend toward significance (p=0.06)
an observed trend (p=0.06)
an obvious trend (p=0.06)
an overall trend (p=0.2)
an unexpected trend (p=0.09)
an unexplained trend (p=0.09)
an unfavorable trend (p<0.10)
appeared to be marginally significant (p<0.10)
approached acceptable levels of statistical significance (p=0.054)
approached but did not quite achieve significance (p>0.05)
approached but fell short of significance (p=0.07)
approached conventional levels of significance (p<0.10)
approached near significance (p=0.06)
approached our criterion of significance (p>0.08)
approached significant (p=0.11)
approached the borderline of significance (p=0.07)
approached the level of significance (p=0.09)
approached trend levels of significance (p0.05)
approached, but did reach, significance (p=0.065)
approaches but fails to achieve a customary level of statistical significance (p=0.154)
approaches statistical significance (p>0.06)
approaching a level of significance (p=0.089)
approaching an acceptable significance level (p=0.056)
approaching borderline significance (p=0.08)
approaching borderline statistical significance (p=0.07)
approaching but not reaching significance (p=0.53)
approaching clinical significance (p=0.07)
approaching close to significance (p<0.1)
approaching conventional significance levels (p=0.06)
approaching conventional statistical significance (p=0.06)
approaching formal significance (p=0.1052)
approaching independent prognostic significance (p=0.08)
approaching marginal levels of significance p<0.107)
approaching marginal significance (p=0.064)
approaching more closely significance (p=0.06)
approaching our preset significance level (p=0.076)
approaching prognostic significance (p=0.052)
approaching significance (p=0.09)
approaching the traditional significance level (p=0.06)
approaching to statistical significance (p=0.075)
approaching, although not reaching, significance (p=0.08)
approaching, but not reaching, significance (p<0.09)
approximately significant (p=0.053)
approximating significance (p=0.09)
arguably significant (p=0.07)
as good as significant (p=0.0502)
at the brink of significance (p=0.06)
at the cusp of significance (p=0.06)
at the edge of significance (p=0.055)
at the limit of significance (p=0.054)
at the limits of significance (p=0.053)
at the margin of significance (p=0.056)
at the margin of statistical significance (p<0.07)
at the verge of significance (p=0.058)
at the very edge of significance (p=0.053)
barely below the level of significance (p=0.06)
barely escaped statistical significance (p=0.07)
barely escapes being statistically significant at the 5% risk level (0.1>p>0.05)
barely failed to attain statistical significance (p=0.067)
barely fails to attain statistical significance at conventional levels (p<0.10
barely insignificant (p=0.075)
barely missed statistical significance (p=0.051)
barely missed the commonly acceptable significance level (p<0.053)
barely outside the range of significance (p=0.06)
barely significant (p=0.07)
below (but verging on) the statistical significant level (p>0.05)
better trends of improvement (p=0.056)
bordered on a statistically significant value (p=0.06)
bordered on being significant (p>0.07)
bordered on being statistically significant (p=0.0502)
bordered on but was not less than the accepted level of significance (p>0.05)
bordered on significant (p=0.09)
borderline conventional significance (p=0.051)
borderline level of statistical significance (p=0.053)
borderline significant (p=0.09)
borderline significant trends (p=0.099)
close to a marginally significant level (p=0.06)
close to being significant (p=0.06)
close to being statistically significant (p=0.055)
close to borderline significance (p=0.072)
close to the boundary of significance (p=0.06)
close to the level of significance (p=0.07)
close to the limit of significance (p=0.17)
close to the margin of significance (p=0.055)
close to the margin of statistical significance (p=0.075)
closely approaches the brink of significance (p=0.07)
closely approaches the statistical significance (p=0.0669)
closely approximating significance (p>0.05)
closely not significant (p=0.06)
closely significant (p=0.058)
close-to-significant (p=0.09)
did not achieve conventional threshold levels of statistical significance (p=0.08)
did not exceed the conventional level of statistical significance (p<0.08)
did not quite achieve acceptable levels of statistical significance (p=0.054)
did not quite achieve significance (p=0.076)
did not quite achieve the conventional levels of significance (p=0.052)
did not quite achieve the threshold for statistical significance (p=0.08)
did not quite attain conventional levels of significance (p=0.07)
did not quite reach a statistically significant level (p=0.108)
did not quite reach conventional levels of statistical significance (p=0.079)
did not quite reach statistical significance (p=0.063)
did not reach the traditional level of significance (p=0.10)
did not reach the usually accepted level of clinical significance (p=0.07)
difference was apparent (p=0.07)
direction heading towards significance (p=0.10)
does not appear to be sufficiently significant (p>0.05)
does not narrowly reach statistical significance (p=0.06)
does not reach the conventional significance level (p=0.098)
effectively significant (p=0.051)
equivocal significance (p=0.06)
essentially significant (p=0.10)
extremely close to significance (p=0.07)
failed to reach significance on this occasion (p=0.09)
failed to reach statistical significance (p=0.06)
fairly close to significance (p=0.065)
fairly significant (p=0.09)
falls just short of standard levels of statistical significance (p=0.06)
fell (just) short of significance (p=0.08)
fell barely short of significance (p=0.08)
fell just short of significance (p=0.07)
fell just short of statistical significance (p=0.12)
fell just short of the traditional definition of statistical significance (p=0.051)
fell marginally short of significance (p=0.07)
fell narrowly short of significance (p=0.0623)
fell only marginally short of significance (p=0.0879)
fell only short of significance (p=0.06)
fell short of significance (p=0.07)
fell slightly short of significance (p>0.0167)
fell somewhat short of significance (p=0.138)
felt short of significance (p=0.07)
flirting with conventional levels of significance (p>0.1)
heading towards significance (p=0.086)
highly significant (p=0.09)
hint of significance (p>0.05)
hovered around significance (p = 0.061)
hovered at nearly a significant level (p=0.058)
hovering closer to statistical significance (p=0.076)
hovers on the brink of significance (p=0.055)
in the edge of significance (p=0.059)
in the verge of significance (p=0.06)
inconclusively significant (p=0.070)
indeterminate significance (p=0.08)
indicative significance (p=0.08)
is just outside the conventional levels of significance
just about significant (p=0.051)
just above the arbitrary level of significance (p=0.07)
just above the margin of significance (p=0.053)
just at the conventional level of significance (p=0.05001)
just barely below the level of significance (p=0.06)
just barely failed to reach significance (p<0.06)
just barely insignificant (p=0.11)
just barely statistically significant (p=0.054)
just beyond significance (p=0.06)
just borderline significant (p=0.058)
just escaped significance (p=0.07)
just failed significance (p=0.057)
just failed to be significant (p=0.072)
just failed to reach statistical significance (p=0.06)
just failing to reach statistical significance (p=0.06)
just fails to reach conventional levels of statistical significance (p=0.07)
just lacked significance (p=0.053)
just marginally significant (p=0.0562)
just missed being statistically significant (p=0.06)
just missing significance (p=0.07)
just on the verge of significance (p=0.06)
just outside accepted levels of significance (p=0.06)
just outside levels of significance (p<0.08)
just outside the bounds of significance (p=0.06)
just outside the conventional levels of significance (p=0.1076)
just outside the level of significance (p=0.0683)
just outside the limits of significance (p=0.06)
just outside the traditional bounds of significance (p=0.06)
just over the limits of statistical significance (p=0.06)
just short of significance (p=0.07)
just shy of significance (p=0.053)
just skirting the boundary of significance (p=0.052)
just tendentially significant (p=0.056)
just tottering on the brink of significance at the 0.05 level
just very slightly missed the significance level (p=0.086)
leaning towards significance (p=0.15)
leaning towards statistical significance (p=0.06)
likely to be significant (p=0.054)
loosely significant (p=0.10)
marginal significance (p=0.07)
marginally and negatively significant (p=0.08)
marginally insignificant (p=0.08)
marginally nonsignificant (p=0.096)
marginally outside the level of significance
marginally significant (p>=0.1)
marginally significant tendency (p=0.08)
marginally statistically significant (p=0.08)
may not be significant (p=0.06)
medium level of significance (p=0.051)
mildly significant (p=0.07)
missed narrowly statistical significance (p=0.054)
moderately significant (p>0.11)
modestly significant (p=0.09)
narrowly avoided significance (p=0.052)
narrowly eluded statistical significance (p=0.0789)
narrowly escaped significance (p=0.08)
narrowly evaded statistical significance (p>0.05)
narrowly failed significance (p=0.054)
narrowly missed achieving significance (p=0.055)
narrowly missed overall significance (p=0.06)
narrowly missed significance (p=0.051)
narrowly missed standard significance levels (p<0.07)
narrowly missed the significance level (p=0.07)
narrowly missing conventional significance (p=0.054)
near limit significance (p=0.073)
near miss of statistical significance (p>0.1)
near nominal significance (p=0.064)
near significance (p=0.07)
near to statistical significance (p=0.056)
near/possible significance(p=0.0661)
near-borderline significance (p=0.10)
near-certain significance (p=0.07)
nearing significance (p<0.051)
nearly acceptable level of significance (p=0.06)
nearly approaches statistical significance (p=0.079)
nearly borderline significance (p=0.052)
nearly negatively significant (p<0.1)
nearly positively significant (p=0.063)
nearly reached a significant level (p=0.07)
nearly reaching the level of significance (p<0.06)
nearly significant (p=0.06)
nearly significant tendency (p=0.06)
nearly, but not quite significant (p>0.06)
near-marginal significance (p=0.18)
near-significant (p=0.09)
near-to-significance (p=0.093)
near-trend significance (p=0.11)
nominally significant (p=0.08)
non-insignificant result (p=0.500)
non-significant in the statistical sense (p>0.05
not absolutely significant but very probably so (p>0.05)
not as significant (p=0.06)
not clearly significant (p=0.08)
not completely significant (p=0.07)
not completely statistically significant (p=0.0811)
not conventionally significant (p=0.089), but..
not currently significant (p=0.06)
not decisively significant (p=0.106)
not entirely significant (p=0.10)
not especially significant (p>0.05)
not exactly significant (p=0.052)
not extremely significant (p<0.06)
not formally significant (p=0.06)
not fully significant (p=0.085)
not globally significant (p=0.11)
not highly significant (p=0.089)
not insignificant (p=0.056)
not markedly significant (p=0.06)
not moderately significant (P>0.20)
not non-significant (p>0.1)
not numerically significant (p>0.05)
not obviously significant (p>0.3)
not overly significant (p>0.08)
not quite borderline significance (p>=0.089)
not quite reach the level of significance (p=0.07)
not quite significant (p=0.118)
not quite within the conventional bounds of statistical significance (p=0.12)
not reliably significant (p=0.091)
not remarkably significant (p=0.236)
not significant by common standards (p=0.099)
not significant by conventional standards (p=0.10)
not significant by traditional standards (p<0.1)
not significant in the formal statistical sense (p=0.08)
not significant in the narrow sense of the word (p=0.29)
not significant in the normally accepted statistical sense (p=0.064)
not significantly significant but..clinically meaningful (p=0.072)
not statistically quite significant (p<0.06)
not strictly significant (p=0.06)
not strictly speaking significant (p=0.057)
not technically significant (p=0.06)
not that significant (p=0.08)
not to an extent that was fully statistically significant (p=0.06)
not too distant from statistical significance at the 10% level
not too far from significant at the 10% level
not totally significant (p=0.09)
not unequivocally significant (p=0.055)
not very definitely significant (p=0.08)
not very definitely significant from the statistical point of view (p=0.08)
not very far from significance (p<0.092)
not very significant (p=0.1)
not very statistically significant (p=0.10)
not wholly significant (p>0.1)
not yet significant (p=0.09)
not strongly significant (p=0.08)
noticeably significant (p=0.055)
on the border of significance (p=0.063)
on the borderline of significance (p=0.0699)
on the borderlines of significance (p=0.08)
on the boundaries of significance (p=0.056)
on the boundary of significance (p=0.055)
on the brink of significance (p=0.052)
on the cusp of conventional statistical significance (p=0.054)
on the cusp of significance (p=0.058)
on the edge of significance (p>0.08)
on the limit to significant (p=0.06)
on the margin of significance (p=0.051)
on the threshold of significance (p=0.059)
on the verge of significance (p=0.053)
on the very borderline of significance (0.05<p<0.06)
on the very fringes of significance (p=0.099)
on the very limits of significance (0.1>p>0.05)
only a little short of significance (p>0.05)
only just failed to meet statistical significance (p=0.051)
only just insignificant (p>0.10)
only just missed significance at the 5% level
only marginally fails to be significant at the 95% level (p=0.06)
only marginally nearly insignificant (p=0.059)
only marginally significant (p=0.9)
only slightly less than significant (p=0.08)
only slightly missed the conventional threshold of significance (p=0.062)
only slightly missed the level of significance (p=0.058)
only slightly missed the significance level (p=0·0556)
only slightly non-significant (p=0.0738)
only slightly significant (p=0.08)
partial significance (p>0.09)
partially significant (p=0.08)
partly significant (p=0.08)
perceivable statistical significance (p=0.0501)
possible significance (p<0.098)
possibly marginally significant (p=0.116)
possibly significant (0.05<p>0.10)
possibly statistically significant (p=0.10)
potentially significant (p>0.1)
practically significant (p=0.06)
probably not experimentally significant (p=0.2)
probably not significant (p>0.25)
probably not statistically significant (p=0.14)
probably significant (p=0.06)
provisionally significant (p=0.073)
quasi-significant (p=0.09)
questionably significant (p=0.13)
quite close to significance at the 10% level (p=0.104)
quite significant (p=0.07)
rather marginal significance (p>0.10)
reached borderline significance (p=0.0509)
reached near significance (p=0.07)
reasonably significant (p=0.07)
remarkably close to significance (p=0.05009)
resides on the edge of significance (p=0.10)
roughly significant (p>0.1)
scarcely significant (0.05<p>0.1)
significant at the .07 level
significant tendency (p=0.09)
significant to some degree (0<p>1)
significant, or close to significant effects (p=0.08, p=0.05)
significantly better overall (p=0.051)
significantly significant (p=0.065)
similar but not nonsignificant trends (p>0.05)
slight evidence of significance (0.1>p>0.05)
slight non-significance (p=0.06)
slight significance (p=0.128)
slight tendency toward significance (p=0.086)
slightly above the level of significance (p=0.06)
slightly below the level of significance (p=0.068)
slightly exceeded significance level (p=0.06)
slightly failed to reach statistical significance (p=0.061)
slightly insignificant (p=0.07)
slightly less than needed for significance (p=0.08)
slightly marginally significant (p=0.06)
slightly missed being of statistical significance (p=0.08)
slightly missed statistical significance (p=0.059)
slightly missed the conventional level of significance (p=0.061)
slightly missed the level of statistical significance (p<0.10)
slightly missed the margin of significance (p=0.051)
slightly not significant (p=0.06)
slightly outside conventional statistical significance (p=0.051)
slightly outside the margins of significance (p=0.08)
slightly outside the range of significance (p=0.09)
slightly outside the significance level (p=0.077)
slightly outside the statistical significance level (p=0.053)
slightly significant (p=0.09)
somewhat marginally significant (p>0.055)
somewhat short of significance (p=0.07)
somewhat significant (p=0.23)
somewhat statistically significant (p=0.092)
strong trend toward significance (p=0.08)
sufficiently close to significance (p=0.07)
suggestive but not quite significant (p=0.061)
suggestive of a significant trend (p=0.08)
suggestive of statistical significance (p=0.06)
suggestively significant (p=0.064)
tailed to insignificance (p=0.1)
tantalisingly close to significance (p=0.104)
technically not significant (p=0.06)
teetering on the brink of significance (p=0.06)
tend to significant (p>0.1)
tended to approach significance (p=0.09)
tended to be significant (p=0.06)
tended toward significance (p=0.13)
tendency toward significance (p approaching 0.1)
tendency toward statistical significance (p=0.07)
tends to approach significance (p=0.12)
tentatively significant (p=0.107)
too far from significance (p=0.12)
trend bordering on statistical significance (p=0.066)
trend in a significant direction (p=0.09)
trend in the direction of significance (p=0.089)
trend significance level (p=0.06)
trend toward (p>0.07)
trending towards significance (p>0.15)
trending towards significant (p=0.099)
uncertain significance (p>0.07)
vaguely significant (p>0.2)
verged on being significant (p=0.11)
verging on significance (p=0.056)
verging on the statistically significant (p<0.1)
verging-on-significant (p=0.06)
very close to approaching significance (p=0.060)
very close to significant (p=0.11)
very close to the conventional level of significance (p=0.055)
very close to the cut-off for significance (p=0.07)
very close to the established statistical significance level of p=0.05 (p=0.065)
very close to the threshold of significance (p=0.07)
very closely approaches the conventional significance level (p=0.055)
very closely brushed the limit of statistical significance (p=0.051)
very narrowly missed significance (p<0.06)
very nearly significant (p=0.0656)
very slightly non-significant (p=0.10)
very slightly significant (p<0.1)
virtually significant (p=0.059)
weak significance (p>0.10)
weakened..significance (p=0.06)
weakly non-significant (p=0.07)
weakly significant (p=0.11)
weakly statistically significant (p=0.0557)
well-nigh significant (p=0.11)
Friday, April 3, 2015

Wednesday, April 1, 2015
Tuesday, March 31, 2015
Rather disturbing developments
BBC: China building 'great wall of sand' in South China Sea. What's more, a lot of the disputed islands are within the Philippines' EEZ.

Sunday, March 29, 2015
Tuesday, March 24, 2015
Is a masteral degree still worth it?
Link. Quote:
In conclusion, modern graduate schools attract talented workers, but often not the best. The opportunity and monetary cost associated make these schools obsolete for the most talented individuals. In 2015, top firms should focus on undergrads when recruiting.It
Thursday, March 19, 2015
New book by Al Roth
Al Roth, co-recipient of the 2012 Nobel Prize in economics, has an upcoming book:

Tuesday, March 17, 2015
Infographic of the day: Hispanic America
Perhaps the most striking bit is that by 2050 less than half of the US population will be white. So the average American by then will only be half-white!

Monday, March 16, 2015
Latest from Reinhart & Rogoff
From their 2014 paper entitled, "Recovery from financial crises: evidence from 100 episodes" (pdf):
Now entering the sixth or seventh year (depending on the country) of crisis, output remains well below its pre-crisis peak in ten of the twelve crisis countries. The gap with potential output is even greater. Delays in accepting that desperate times call for desperate measures keeps raising the odds that, as documented here, this crisis may in the end surpass in severity the depression of the 1930s in a large number of countries.
Sunday, March 8, 2015
History of supply & demand
Here. Excerpt:
Economists usually see Alfred Marshall as the originator of standard demand and supply diagrams and their use in economic analysis including welfare applications and consumer surplus. However, it turns out that Marshall’s diagram was not the first use of demand and supply curves. Cournot originates a scissors type diagram to illustrate tax incidence in 1838 that has a demand and a supply curve with price on the horizontal axis and quantity on the vertical axis. Indeed, at least five economists used similar tools before Marshall published it – Antoine Cournot (1838), Karl Rau (1841), Jules Dupuit (1844), Hans Von Mangoldt (1863) and Fleeming Jenkin (1870). According to Humphrey (1992), these individuals were largely unaware of the others work.
Monday, March 2, 2015

Thursday, February 26, 2015
Tuesday, February 17, 2015

Monday, February 16, 2015
Excerpts from UPSE's 50th Anniversary Gala Night
Quote from the ever eloquent and poetic Dean Fab:
On teaching. That the UPSE faculty maintains a romance with creative thinking should be a given; it should however maintain on the side a romance with the tuition of its harvests. In UPSE, we did not and in future shall never tolerate the neglect of our tutees on the pretext of more important involvements. There are none such. Our tuition is the precious pipeline for the propagation of our DNA and to a better future.
In the past I have as a mark of endearment referred to UPSE as “Camelot”. The roots of this imagery goes back to the 80’s when UPSE stood as a forlorn and even maligned contrarian in the University campus: it stood for the market economics when the most swore by the Socialist command economy. We were labeled the imperialist running dogs, stooges of the hated World Bank and IMF and even jukebox economists. Nonetheless, as Pepe repeatedly observed, “we were outnumbered, but were never outgunned.” If we were on trial, we pleaded guilty only to “rigor of logic and clarity of thinking.” UPSE like Camelot was a beacon of light then; UPSE will be a Camelot thence.
Friday, February 13, 2015
Happy Valentine's from my office
Happy Valentines from Eko and Miya! pic.twitter.com/WHnxg27Mf9
— NEDA Central Office (@NEDAhq) February 13, 2015
Thursday, February 12, 2015

Competition vs. cooperation
A thoughtful piece by the Conversable Economist, Timothy Taylor:
Cooperation refers to a situation in which the participants seek out win-win outcomes from working together. Thus, the opposite of cooperation would be a situation in which such win-win outcomes are difficult or discouraged. For example, this could reflect a situation of lawlessness or a set of social norms in which people expect that cooperative agreements are likely to be broken—and, thus, the incentive to cooperate is low.
If both competition and cooperation are understood as voluntary choices (and, after all, "involuntary cooperation" is an oxymoron), then a fully planned economy would be the opposite of both competition and cooperation. When government dictates prices and quantities, a planned economy eliminates the incentives of market participants—whether suppliers, producers, or consumers—either to compete or to cooperate.
Those of us who self-identify as economists should not wear the terminology of "competition" as a badge of shame, while wistfully contemplating a presumed ideal of cooperation. For the study of economics, as in the real-world economy, the concepts and practices of competition and cooperation are inevitably interlocking.
Sunday, February 8, 2015
History of the Gerry Sicat Award
Dr. Sicat writes at the Philippine Star about the history of the award named after him at the UP School of Economics:
The GPS awards. Allow me a moment of immodesty and to talk about something that I am very proud of. It might be, in the scope of things, very small. But the end product has turned up very positive for the students and the School.
I refer to the so-called “G.P.Sicat awards” for the most outstanding undergraduate papers at the School. In 1972, I was no longer in the faculty because I was actively engaged in national economic affairs. I suggested to both Drs. Amado Castro and Jose Encarnacion, Jr. that I contribute a small award to give a prize to the most outstanding paper by a graduating senior. To make it possible, I started a small fund. Through the years, the small fund grew, and, especially after 1983, royalties from my Economics text filled it further. It was able, even, by the 1990s, to sponsor at least an annual graduate scholarship too.
From 1973 to 2014, a total of 206 student were recipients of the GPS awards among the best graduating papers. Had the original plan of a yearly prize for only one paper each been followed, there would have been only 41 prizes.
Dean Philip Medalla apprised me, when I was working in Washington D.C. at the World Bank, that the quality of student papers had gone up, that the best students were spending their time writing on a variety of relevant development topics in economics, and that on commencement day when the award was also announced, the GPS award became among the most coveted by the top-rung graduating students.It's quite a privilege to have been part of this institution! Here's to the golden year of UPSE!
Friday, February 6, 2015
Graph of the day: US crude oil production

An unprecedented increase in the past 5 years! Looks like the new age of cheap oil is here to stay.
Monday, January 26, 2015
Plotting activity of the day: SWS hunger data
From (largely) quarterly SWS data on total hunger incidence (% of households who experienced having nothing to eat at least once in the past 3 months)...


...I got this trend line with a polynomial fit (order=6) superimposed. I tried reverse engineering an existing line graph online using PlotDigitizer when I had no data to work on, but it turned out to be largely inaccurate unless the data points were identifiable.
Friday, January 2, 2015
The permanence of negative growth shocks
This recent post on Econbrowser is worth reposting in full.
Suppose that output Y grows at 1% quarterly in log terms.
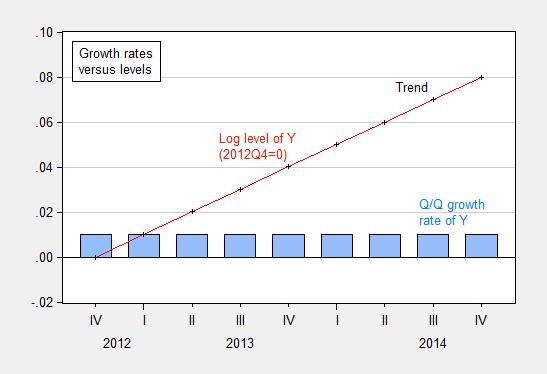
Suppose that output Y grows at 1% quarterly in log terms.
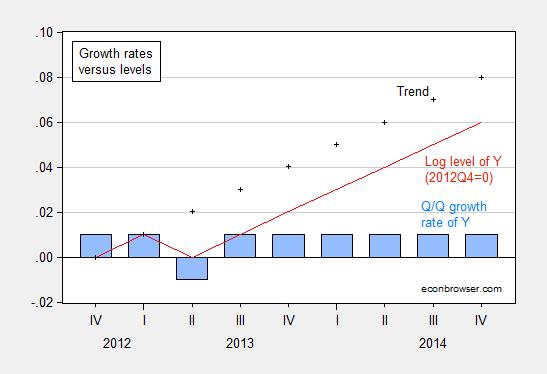
Then a 2 percentage-point drop in one quarter will permanently decrease the trend even if growth reverts back to the pre-shock level in the succeeding quarter.
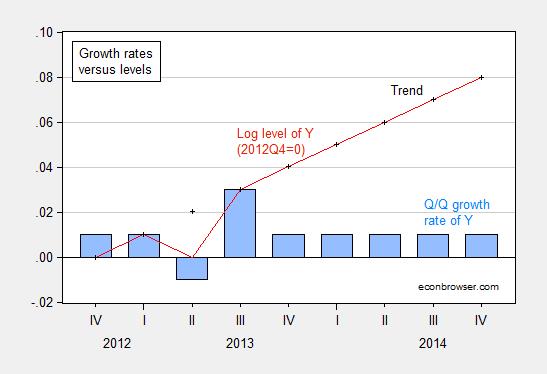
The only way to revert back to the pre-shock trend is to balance the 2-ppt drop by a subsequent 2-ppt increase in a subsequent period.
This simple illustration resonates with the economic crises experienced during the Marcos era, which undoubtedly had permanent negative effects that we are only recently counteracting with stellar growth. Our future leaders should take heed of these potential permanent effects.
Link fiesta (1.2.15)
Happy New Year! Here's a string of links to start off the year.
- 2015: A big year for development. (link)
- The latest on the question: Does aid work? (link)
- Is it time to get rid of currency? (link)
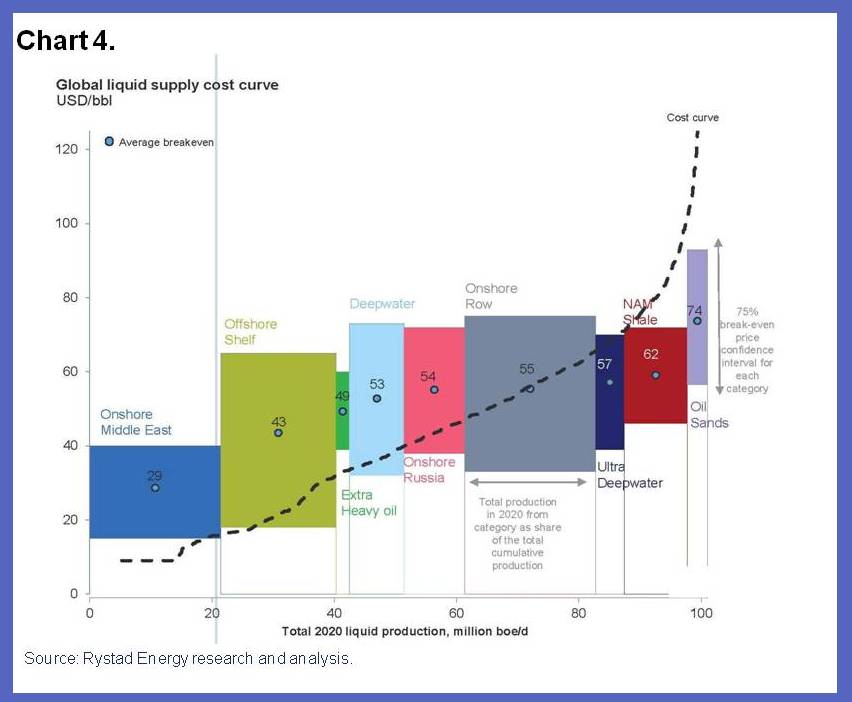
- Global liquid oil supply curve. (link) Also, Oliver Blanchard of the IMF and MIT on the world oil prices. (link)
- Mankiw on Piketty; he's not impressed. (link)
- Tabarrok on Piketty; it's all dependent on the fertility and bequest decisions of the rich. (link)
- Interview of Harvard's Raj Chetty. (link)
- The most influential economists c. 2014. (link, link)
- How will commerce be regulated/adjudicated in outer space? (link)
- "Their bottom line is that it is not necessary to have a government that rules outer space in order to have a recognized legal system for dispute resolution in outer space."
- Do children and animals avoid the sunk cost fallacy? (link)
- The health effects of unemployment. (link)
- What 2000 calories look like. (link)
- America's Christmas gift list 2014 (as seen in Google searches). (link)
- The US Census Bureau vs. academics. Underscores the critical role played by government surveys in uncovering social trends. (link)
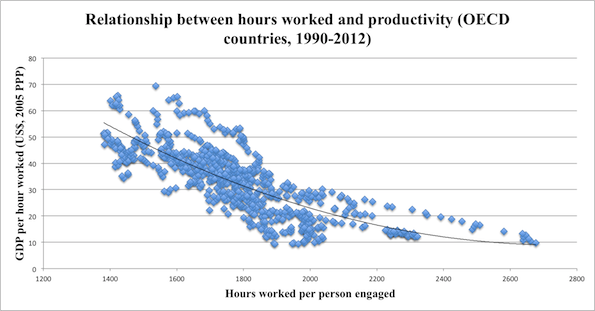
- Productivity decreases with work hours in OECD countries. (link)
Subscribe to:
Posts (Atom)